Profiling SwiftUI app using Instruments
Xcode comes with a bunch of tools you need to build, debug and release your apps. One of these tools is the Instruments app. The Instruments app is a great tool for profiling your iOS apps. It provides many profiling templates for debugging Core Data, catching memory leaks, disk read/writes, and much more. This week we will learn how to profile SwiftUI apps using the SwiftUI template.
Compare designs, show rulers, add a grid, quick actions for recent builds. Create recordings with touches & audio, trim and export them into MP4 or GIF and share them anywhere using drag & drop. Add bezels to screenshots and videos. Try now
Many developers profile apps only when they have some issues. That’s why Instruments looks like the hidden gem of Xcode. I suggest you profile your apps on a weekly or bi-weekly basis. Profiling your app by making incremental changes is the best way to identify and fix small performance downgrades.

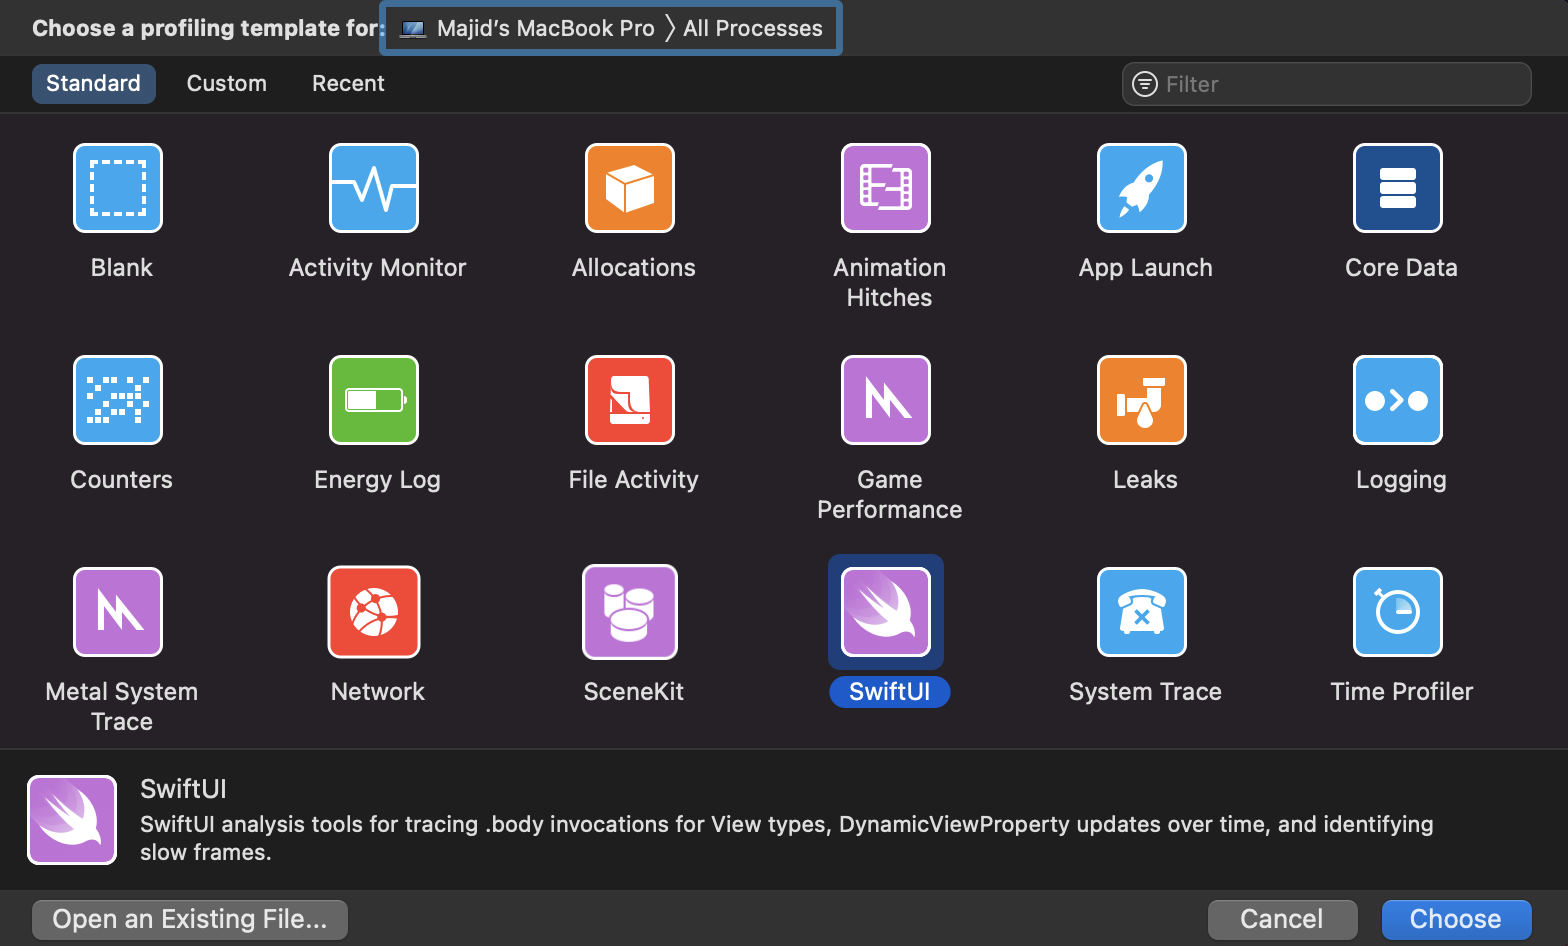
First of all, you need to build the app in profiling mode by selecting Product -> Profile or pressing CMD+I. Remember that you should profile your app only on the real device and not the simulator. Then you can select the SwiftUI template in the newly opened Instruments window and press the record button.

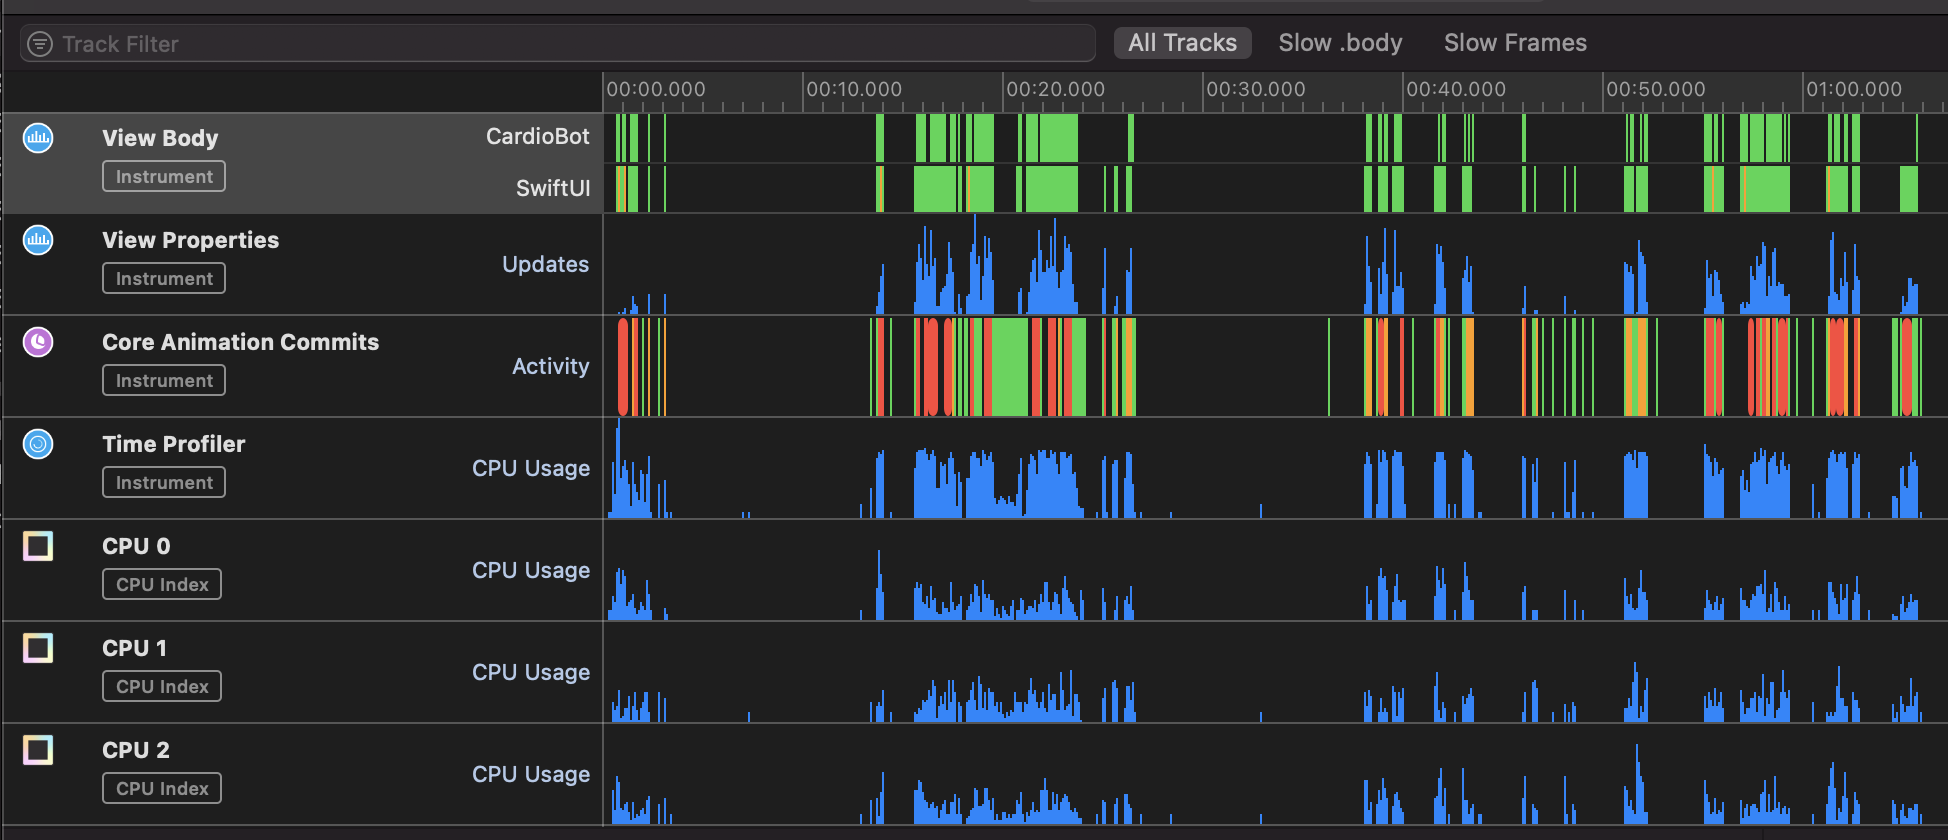
SwiftUI profiling template is divided into four main sections: View Body, View Properties, Core Animation Commits, Time Profiler. By understanding the values in these sections, you can investigate the issues that your app might have.
View Body
The first section you see is View Body. As you already know, SwiftUI calls the body property of your views to understand changes in the view hierarchy and render them. SwiftUI calls body property whenever view dependencies change. For example, when you change the value of the state or observed object.

The most interesting value here is the Average Duration. You should keep your body properties as fast as possible. Don’t create heavy objects inside the body property. For example, try to avoid creating DateFormatter inside the body property.
To learn more about the diffing process that SwiftUI applies, take a look at my “You have to change mindset to use SwiftUI” post.
Remember that iOS uses 16ms frames to render your app. On devices with ProMotion display iOS uses even shorter 8ms frames. SwiftUI runs the body property whenever you change view dependencies, diff it with the previous version, and commit the Core Animation transaction. You should keep the whole process inside the 8ms time frame. In other cases, you will have a glitch.
View Properties
In the View Properties section, you can find every changed view property. You should expect to have view property updates more often than body property calls because SwiftUI merge multiple property updates to run a single body update.
Here you can check the values of changed properties and find the properties which update more often than you need or expect.

Time Profiler
In the Time Profiler section, you can find the timing for every function in your app. You can see the heaviest stack trace on the right, and usually, this is all you need to solve a performance issue. The filters pane on the bottom is where you can hide system libraries by pressing the Call Tree button.

To learn more about other templates available in Instruments app, take a look at “Instruments Tutorial with Swift: Getting Started”.
Conclusion
Today we have learned how to use Instruments app and its SwiftUI template to profile our apps. I hope you enjoy the post. Feel free to follow me on Twitter and ask your questions related to this article. Thanks for reading, and see you next week!