Mastering charts in SwiftUI. Pie and Donut charts.
One of the additions to the Swift Charts framework after WWDC 23 was a brand new SectorMark type. The SectorMark allows us to build pie and donut charts in SwiftUI easily. This week, we will learn how to plot the data using SectorMark.
Compare designs, show rulers, add a grid, quick actions for recent builds. Create recordings with touches & audio, trim and export them into MP4 or GIF and share them anywhere using drag & drop. Add bezels to screenshots and videos. Try now
The Swift Charts framework provides us with mark types like BarMark, LineMark, etc. Mark types allow us to define a piece of data on the chart declaratively. SectorMark is another mark type we can use to plot a pie or donut chart.
import SwiftUI
import Charts

struct Product: Identifiable {
    let id = UUID()
    let title: String
    let revenue: Double
}

struct SectorChartExample: View {
    @State private var products: [Product] = [
        .init(title: "Annual", revenue: 0.7),
        .init(title: "Monthly", revenue: 0.2),
        .init(title: "Lifetime", revenue: 0.1)
    ]

    var body: some View {
        Chart(products) { product in
            SectorMark(
                angle: .value(
                    Text(verbatim: product.title),
                    product.revenue
                )
            )
            .foregroundStyle(
                by: .value(
                    Text(verbatim: product.title),
                    product.title
                )
            )
        }
    }
}

As you can see in the example above, we use the SectorMark type to plot a pie chart. We use the foregroundStyle modifier to fill sections with different colors as we do with other mark types.
To learn more about mark styling, take a look at my dedicated “Mastering charts in SwiftUI. Mark styling.” post.
Whenever we create an instance of the SectorMark type, we must pass the angle parameter. It might be a plottable value defining an angle portion of the section, or we can pass a range with exact start and end values of the angle for a particular area.
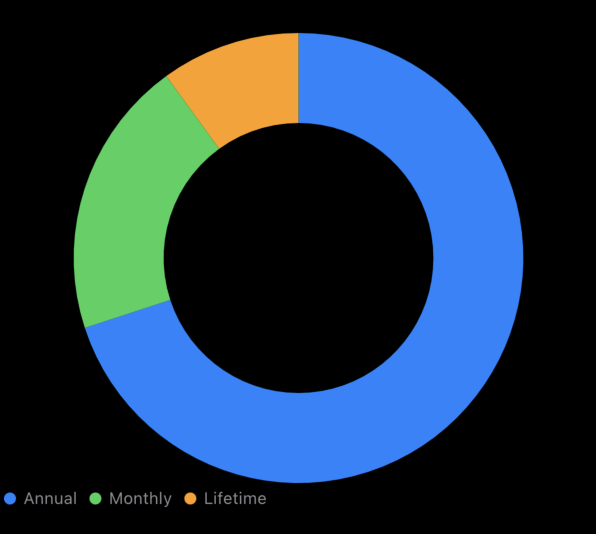
The second parameter of the SectorMark initializer is the innerRadius value. We can use it to transform our pie chart into a donut chart.
struct SectorChartExample: View {
    @State private var products: [Product] = [
        .init(title: "Annual", revenue: 0.7),
        .init(title: "Monthly", revenue: 0.2),
        .init(title: "Lifetime", revenue: 0.1)
    ]

    var body: some View {
        Chart(products) { product in
            SectorMark(
                angle: .value(
                    Text(verbatim: product.title),
                    product.revenue
                ),
                innerRadius: .ratio(0.6)
            )
            .foregroundStyle(
                by: .value(
                    Text(verbatim: product.title),
                    product.title
                )
            )
        }
    }
}

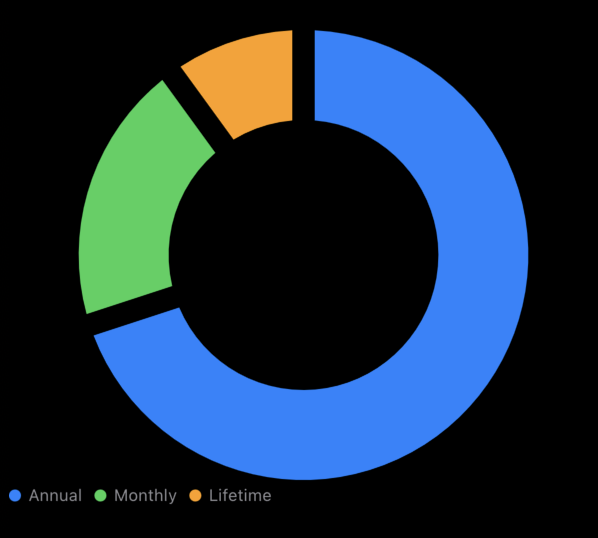
As you can see in the example above, we use the innerRadius parameter to plot a donut chart. The innerRadius parameter accepts ratio, inset, and fixed sizes. We can use the angularInset parameter to set the spacing between sectors of the pie or donut charts.
struct SectorChartExample: View {
    @State private var products: [Product] = [
        .init(title: "Annual", revenue: 0.7),
        .init(title: "Monthly", revenue: 0.2),
        .init(title: "Lifetime", revenue: 0.1)
    ]

    var body: some View {
        Chart(products) { product in
            SectorMark(
                angle: .value(
                    Text(verbatim: product.title),
                    product.revenue
                ),
                innerRadius: .ratio(0.6),
                angularInset: 8
            )
            .foregroundStyle(
                by: .value(
                    Text(verbatim: product.title),
                    product.title
                )
            )
        }
    }
}

As you can see, the SectorMark type is a simple chart mark that supports all the modifiers we use for other mark types to customize them. I hope you enjoy the post. Feel free to follow me on Twitter and ask your questions related to this post. Thanks for reading, and see you next week!