Mastering charts in SwiftUI. Custom Marks.
The Swift Charts framework is an excellent example of composition. In the previous posts, we saw how we could use different marks on the same chart view to plot different data points. This week we will learn how to use composition to build new custom mark types and reuse them across the app.
Compare designs, show rulers, add a grid, quick actions for recent builds. Create recordings with touches & audio, trim and export them into MP4 or GIF and share them anywhere using drag & drop. Add bezels to screenshots and videos. Try now
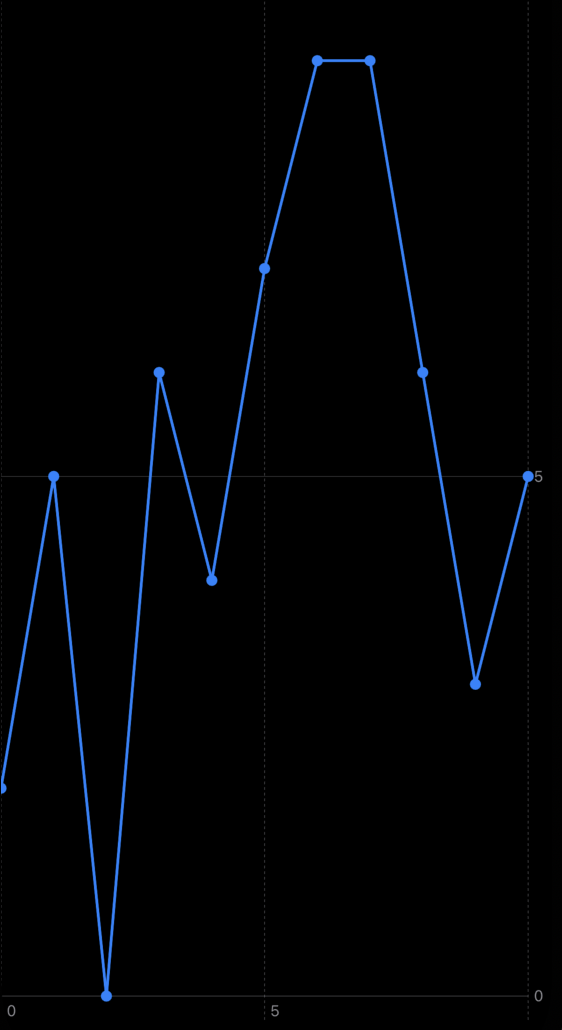
Let’s take a look at the basic example of composition in the Swift Charts framework by plotting a line chart with point marks.
struct ContentView1: View {
    @State private var numbers = (0...10)
        .map { _ in Int.random(in: 0...10) }

    var body: some View {
        Chart {
            ForEach(Array(numbers.enumerated()), id: \.element) { index, number in
                LineMark(
                    x: .value("index", index),
                    y: .value("value", number)
                )

                PointMark(
                    x: .value("index", index),
                    y: .value("value", number)
                )
            }
        }
    }
}

As you can see in the example above, we use a single chart view to plot both lines and points on it. We can use the same strategy to create super custom marks that the Swift Charts framework doesn’t provide out of the box.
To learn more about the basics of the Charts framework, take a look at my dedicated “Mastering charts in SwiftUI. Basics.” post.
Charts are viral in the financial industry, and the unique candlestick chart is used to present market prices visually. The Swift Charts framework doesn’t provide us with the candlestick mark, but fortunately, we can build it by using the composition of other primitive marks.
Let’s think about candlestick marks and how we can implement them using the Swift Charts framework. Every candlestick mark should display the lowest and highest prices. It doesn’t stop there because it also should present another two prices indicating market open and close prices.
Fortunately, the Swift Charts framework provides us with the RectangleMark type allowing us to place a rectangle in the plot area using the X value and two values representing the Y start and Y end.
struct Candle: Hashable {
    let open: Double
    let close: Double
    let low: Double
    let high: Double
}

struct ContentView2: View {
    let candles: [Candle] = [
        .init(open: 3, close: 6, low: 1, high: 8),
        .init(open: 4, close: 7, low: 2, high: 9),
        .init(open: 5, close: 8, low: 3, high: 10)
    ]

    var body: some View {
        Chart {
            ForEach(Array(zip(candles.indices, candles)), id: \.1) { index, candle in
                RectangleMark(
                    x: .value("index", index),
                    yStart: .value("low", candle.low),
                    yEnd: .value("high", candle.high),
                    width: 4
                )

                RectangleMark(
                    x: .value("index", index),
                    yStart: .value("open", candle.open),
                    yEnd: .value("close", candle.close),
                    width: 16
                )
                .foregroundStyle(.red)
            }
        }
    }
}

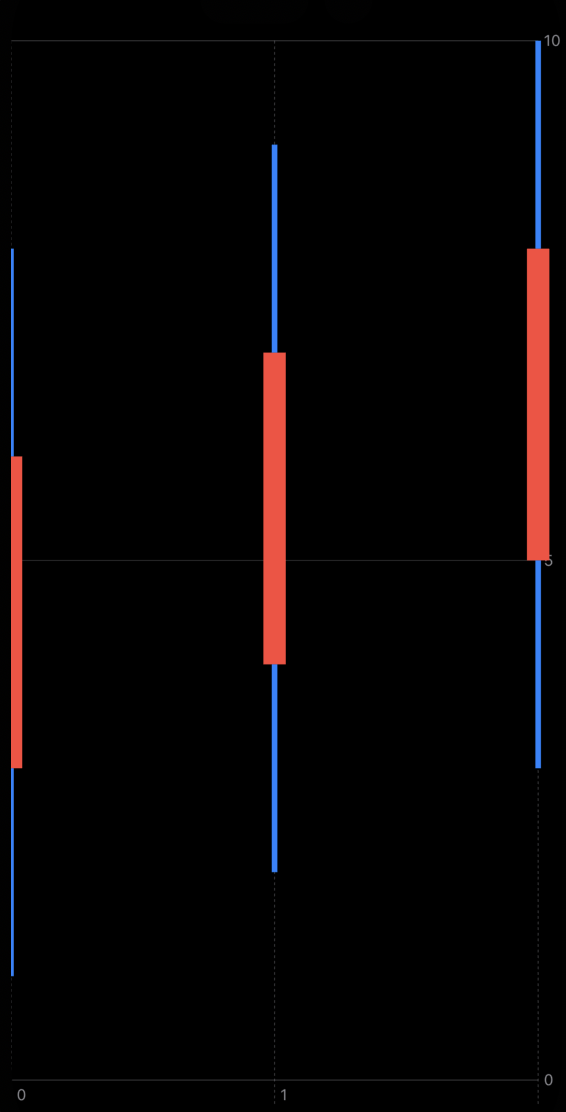
As you can see in the example above, we use RectangleMark type to plot candles. We use the composition of two rectangle marks where the first rectangle displays the low/high price pair, and the second one presents the open/close price pair.
RectangeMark type provides the width parameter allowing us to tune the width of the plotted rectangle on the chart. We efficiently use it to separate two pairs of prices visually.
Ok, it looks good, but in the case of the chart-heavy financial apps, we might have a bunch of screens with different candlestick charts, and I don’t want to duplicate this code so many times. I want to extract my code in the particular CandlestickMark type and reuse it across my app.
Fortunately, the Swift Charts framework provides us with the ChartContent protocol. Every mark provided by the Swift Charts framework conforms to this protocol and inherits basic modifiers like foregroundStyle, offset, etc.
struct CandlestickMark<X: Plottable, Y: Plottable>: ChartContent {
    let x: PlottableValue<X>
    let low: PlottableValue<Y>
    let high: PlottableValue<Y>
    let open: PlottableValue<Y>
    let close: PlottableValue<Y>

    init(
        x: PlottableValue<X>,
        low: PlottableValue<Y>,
        high: PlottableValue<Y>,
        open: PlottableValue<Y>,
        close: PlottableValue<Y>
    ) {
        self.x = x
        self.low = low
        self.high = high
        self.open = open
        self.close = close
    }

    var body: some ChartContent {
        RectangleMark(x: x, yStart: low, yEnd: high, width: 4)
        RectangleMark(x: x, yStart: open, yEnd: close, width: 16)
            .foregroundStyle(.red)
    }
}
Here we create the CandlestickMark type conforming to the ChartContent protocol. The ChartContent protocol has the only requirement: the body property, which should return some instance of the ChartContent protocol. The API is very similar to SwiftUI’s View protocol.
In the body property of the CandlestickMark, we use the same pair of RectangleMark to plot our candle. Here we follow the same API that other mark types provide and use the PlottableValue type as input for our mark type. Now we are ready to use it in our code.
struct ContentView: View {
    var body: some View {
        Chart {
            ForEach(0...10, id: \.self) { index in
                CandleMark(
                    x: .value("index", index),
                    low: .value("low", Int.random(in: 0...2)),
                    high: .value("high", Int.random(in: 8...10)),
                    open: .value("open", Int.random(in: 2...8)),
                    close: .value("close", Int.random(in: 2...8))
                )
                .foregroundStyle(.green)
            }
        }
    }
By conforming our type to the ChartContent protocol, we create another fully-functional mark type that inherits all the modifiers we used to see in standard marks. We can easily apply the foregroundStyle or offset modifiers on it.
To learn more about customization options available via the ChartContent protocol, take a look at my dedicated “Mastering charts in SwiftUI. Mark styling.” post.
Today we learned how to use composition in the Swift Charts framework to create new types of marks and reuse them across the app. I hope you enjoy the post. Feel free to follow me on Twitter and ask your questions related to this post. Thanks for reading, and see you next week!