Mastering charts in SwiftUI. Legends.
Last week we started the topic of the Swift Charts framework customization options using a bunch of chart view modifiers. It is a vast topic that I divide into a few small posts. This week we will discuss configuring the legend view using the new Swift Charts framework.
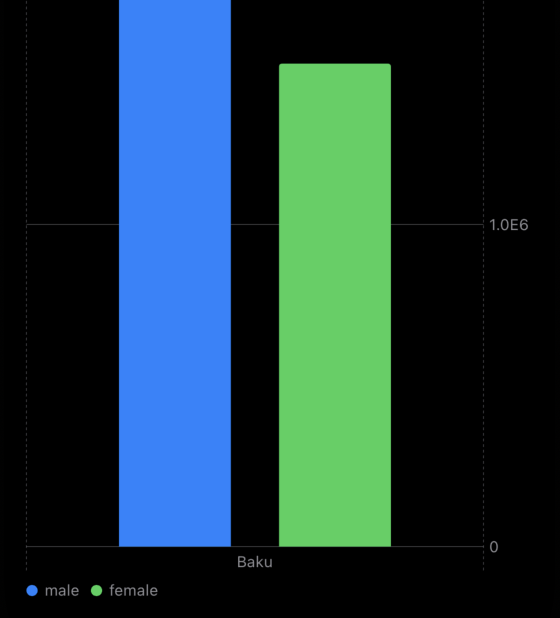
The Swift Charts framework is smart enough to infer and display the legend view for your chart automatically. Let’s take a look at the concrete example.
struct ContentView: View {
    let stats: [Stats]

    var body: some View {
        Chart {
            ForEach(stats, id: \.city) { stat in
                BarMark(
                    x: .value("City", stat.city),
                    y: .value("Population", stat.population)
                )
                .foregroundStyle(by: .value("Gender", stat.gender))
                .position(by: .value("Gender", stat.gender))
            }
        }
    }
}
To learn more about the basics of the Charts framework, take a look at my dedicated “Mastering charts in SwiftUI. Basics.” post.
As you can see in the example above, our chart has a legend view automatically generated by the Swift Charts framework. We use the foregroundStyle modifier on the BarMark type, which allows the framework to create a legend view. It looks good, but what if we don’t need the legend view at all? In this case, we can use the chartLegend view modifier to control the visibility of the legend view.
struct ContentView: View {
    let stats: [Stats]

    var body: some View {
        Chart {
            ForEach(stats, id: \.city) { stat in
                BarMark(
                    x: .value("City", stat.city),
                    y: .value("Population", stat.population)
                )
                .foregroundStyle(by: .value("Gender", stat.gender))
                .position(by: .value("Gender", stat.gender))
            }
        }
        .chartLegend(.hidden)
    }
}
The chartLegend modifier allows us to control the visibility of the legend view by passing one of these three options: automatic, visible, and hidden. Another overload of the chartLegend modifier allows us to control the legend view’s position, alignment, and spacing.
struct ContentView: View {
    let stats: [Stats]

    var body: some View {
        Chart {
            ForEach(stats, id: \.city) { stat in
                BarMark(
                    x: .value("City", stat.city),
                    y: .value("Population", stat.population)
                )
                .foregroundStyle(by: .value("Gender", stat.gender))
                .position(by: .value("Gender", stat.gender))
            }
        }
        .chartLegend(position: .top, alignment: .leading, spacing: 8)
    }
}
Let’s move forward and customize the colors for our bars and circles in the legend view representing them.
struct ContentView: View {
    let stats: [Stats]

    var body: some View {
        Chart {
            ForEach(stats, id: \.city) { stat in
                BarMark(
                    x: .value("City", stat.city),
                    y: .value("Population", stat.population)
                )
                .foregroundStyle(by: .value("Gender", stat.gender))
                .position(by: .value("Gender", stat.gender))
            }
        }
        .chartForegroundStyleScale(
            domain: Gender.allCases,
            range: [.red, .orange, .black]
        )
    }
}
As you can see in the example above, we use the chartForegroundStyleScale modifier to provide both values and colors representing that values. The chartForegroundStyleScale modifier pairs with the foregroundStyle modifier and maps values you pass to colors on the chart and in the legend view.
To learn more about customization options of the Charts framework, take a look at my dedicated “Mastering charts in SwiftUI. Customizations.” post.
You might need to provide static data for your legend view in some specific cases. For that, you can use another overload of the chartForegroundStyleScale modifier accepting a key-value literal.
struct ContentView: View {
    let stats: [Stats]

    var body: some View {
        Chart {
            ForEach(stats, id: \.city) { stat in
                BarMark(
                    x: .value("City", stat.city),
                    y: .value("Population", stat.population)
                )
                .foregroundStyle(by: .value("Gender", stat.gender))
                .position(by: .value("Gender", stat.gender))
            }
        }
        .chartForegroundStyleScale(
            [
                Gender.notSet: Color.black,
                .female: Color.orange,
                .male: Color.red
            ]
        )
    }
}
In the example above, we use the chartForegroundStyleScale and pass the dictionary with gender-color pairs. Usually, we generate this data dynamically using some logic, but you can also hardcode these values if needed.
I hope you enjoy the post. Feel free to follow me on Twitter and ask your questions related to this post. Thanks for reading, and see you next week!